Structures and Correlations
With a student, I’ve been working of developing structure function and correlation function approach to analyzing spectral line data cubes. First, we’ve been working with the structure function of order :
where usually. We’ve investigated a set of properties including the noise behaviour of the structure function and the maximum value attainable. The final thing to consider is the relationship between the structure function and the correlation function . In cosmology, the correlation function is defined as the excess probability of finding a galaxy within a distance of another galaxy:
where is the volume density of galaxies and is a volume element. In a totally random universe, the probability of finding a galaxy would just be density integrated over the volume considered, so .
If we were going to calculate the correlation function from a set of point masses, we would have to evaluate an estimator of the form
based on the work of Landy & Szalay (1983). Here, is notation that means the number of galaxies (of total) found in the actual data with separations of . This must be a binned estimator where you consider the number in a small interval around . is number of the separation between pairs of galaxies in a randomized set of galaxies, with the same selection volume as the original survey producing . The term is a mix term where one point is drawn from the original data list and one from the randomized sample. Terms with random samples can be generated from multiple realizations and then averaged.
We are interested in the relationship between and (ignoring for the moment the component). Furthermore, we want to consider a field, i.e., not a bunch of point-like galaxies but rather a continuous function. We are specifically considering the case of images of molecular emission. Instead of partitioning the emission into molecular clouds, we are instead going to calculate the correlation function between positions in an image. If we consider a pixelated image with intensity values , we define the correlation function between two pixels using the geometry described in this figure:
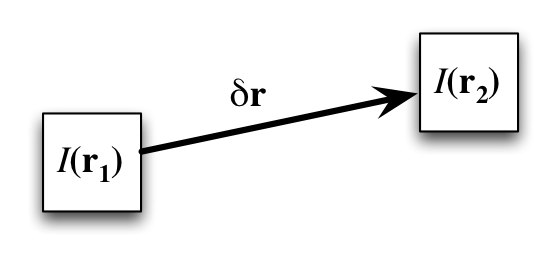
If we were considering these pixels as being regions filled with galaxies and the number of galaxies in the pixels are and respectively, then the correlation function with have a contribution from this pair of pixels that is equal to the number of possible data pairs that could be formed between these two values: . Then, the term of the correlation function would look like:
Similarly, the term would look a lot like the average product of a bunch of random draws from the pixels .
Since the averages represent random draws from the image values, there is no correlation between the draws. Thus, we get that the average value of the product is the product of the averages:
Or, this is the mean value of the image, squared. Because Monte Carlo beats actually thinking any day, I verified this by doing many random draws from an image and calculating the average product. It checks out. By similar reasoning, I think that for images, but I haven’t checked this.
Finally, the connection to structure functions comes from expanding the square in the structure function: